When I saw that VMware had updated the SNMP management pack for vROps a little while ago i wanted to test and see what it could be used for. But first I want to thank Steven Bright at https://www.stevenbright.com for making the job a bit easier with his blog Monitoring devices using SNMP in vRealize Operations 8.1 In my post I will go into details on installing the XUPS-MIB file and the creation of the Eaton UPS dashboard.
Before you begin
I would always recommend to check if there is a management pack available for the devices you want to monitor. When it comes Eaton UPS devices a quick search on the VMware Marketplace reveals that there is a management pack, unfortunately it is old and outdated. This is of course a bummer but we can still monitor the devices using SNMP and creating our own views and dashboards. A tip for this dashboard is that you can download the old management pack and extract the UPS icon for use with our Eaton UPS dashboard.
Preparation
So how can I monitor my device using the SNMP management pack. First make sure you have the SNMP details for the devices you want to monitor. And verify if the MIB file is present inside vROps. In my case it was not, so I had to figure out what MIB file to use and where to download the Eaton MIB files. I also made sure the devices was updated with the latest firmware found at Eatons download page.
How to upload MIB files to vROps
To upload the Eaton MIB files to my vROps nodes I tried to follow the VMware documentation on how to upload MIB files. It gives us the info but not all the details. So here’s a detailed description on how I did it.
Step 1
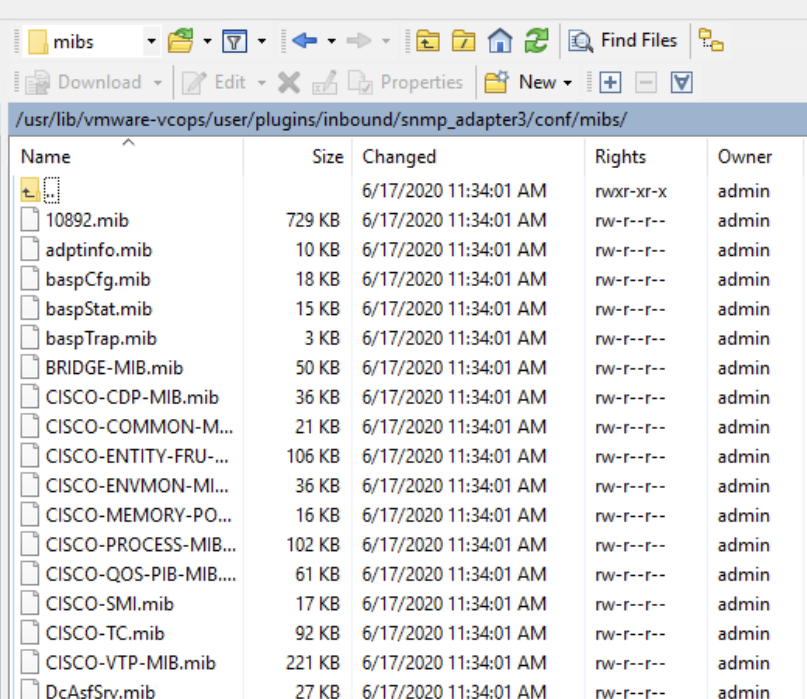
I used WinSCP and Putty when uploading the MIB file and running the script on all vROps nodes. Navigate to the location of the mib files and upload your mib files.
usr/lib/vmware-vcops/user/plugins/inbound/snmp_adapter3/conf
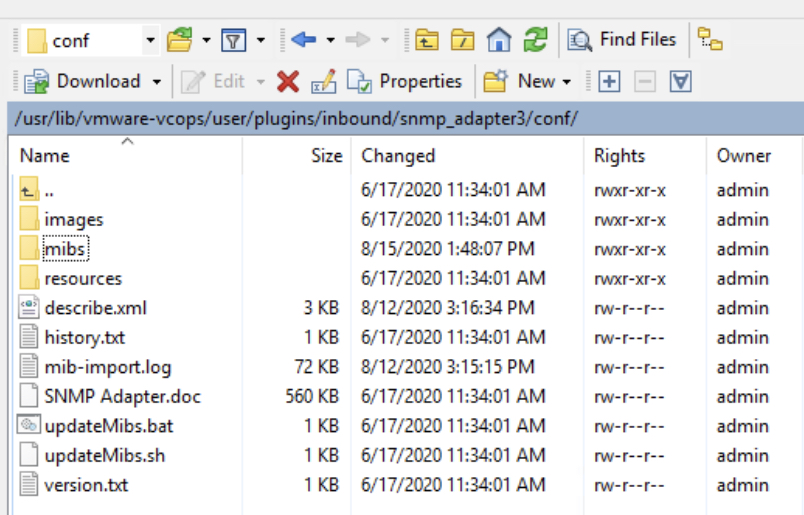
Step 2
When the mib file is uploaded go to usr/lib/vmware-vcops/user/plugins/inbound/snmp_adapter3/conf and I run the updateMibs.sh script file.
sh updateMibs.sh
When that is done you can check the mib-import.log file to search for your newly imported mib file. If you can’t find it some thing went wrong. Once you have verified that the mib is in the log file you are good to go.
Important: Many of the mib files are called MIB something, make sure that your mib file have the .mib extension or it won’t import. It happened to me once, the filename ended on MIB so I dint see that the .mib extension was missing. This type of issue is easy to miss but also easy to catch if you verify using the mib-import.log after running the updateMibs.sh file.
Step 3
Edit the describe.xml file and update the version number shown in RED.
<?xml version="1.0" encoding="UTF-8"?>
<!-- Copyright (c) 2007-2020 VMware, Inc. All rights reserved -->
<AdapterKind key="SNMPAdapter" nameKey="1" version="9"
xmlns:xsi="http://www.w3.org/2001/XMLSchema-instance"
Make sure step 1-3 is done on all your vrops nodes.
Step 4
Login to your vROps appliance and run redescribe.
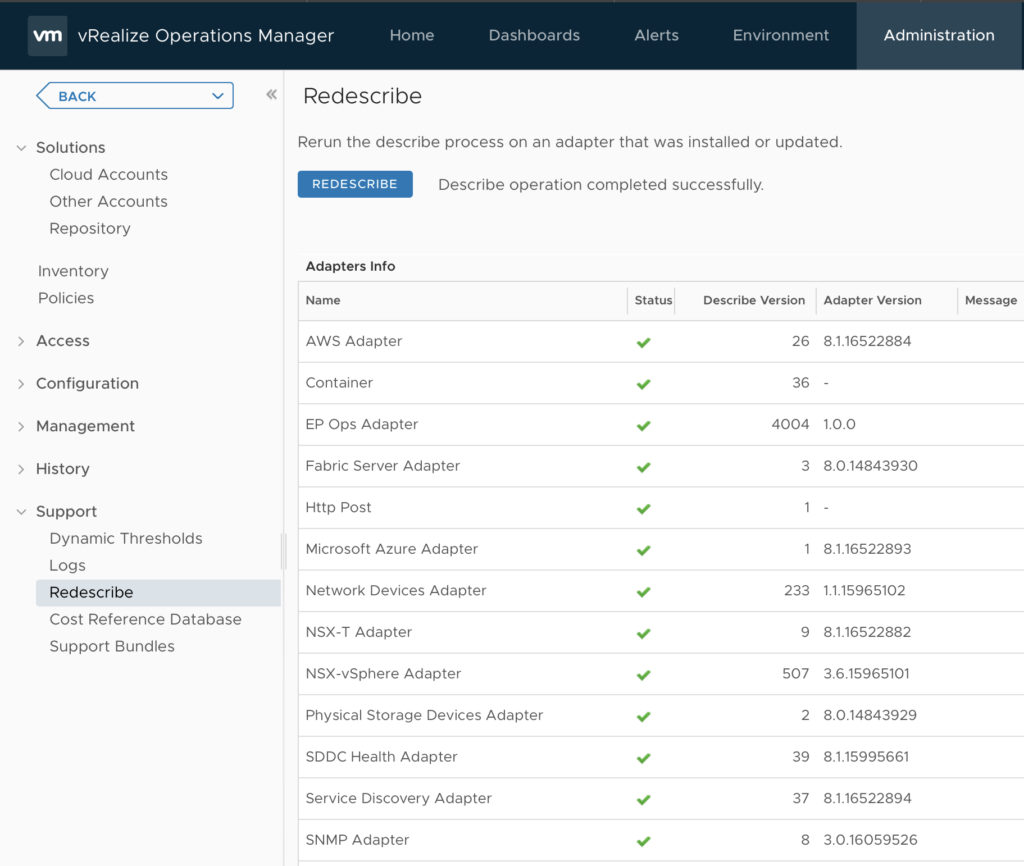
Verify: You can verify that you have done everyting correctly. The number for the SNMP Adapter in the Describe Version column should match the number in the describe.xml file you just updated. When you run the redescribed it should increase to the new number.
You are now done with the import and should be able to add a new adapter and find your newly imported MIB in the adapter mib file list.
Collecting data and creating the dashboard
I won’t go into details on how to add the adapters and create custom groups as that is thoughly described in Stevens blog. But when you have created a custom group for the devices, custom alerts and a new policy for collecting the mib data you need to figure out what data to collect and how to present it. I used Circitor.fr to find some more details about the XUPS-MIB file.
In my case certain UPS models seemed to work fine but no data was received inside vROps. This issue was resolved when I changed the settings to use SNMPv3.
What OIDs to use
I guess it depends on what you want to monitor, present and do trends on. I focused on the following in my dashboard.
XUPS-MIB|iso|org|dod|internet|private|enterprises|powerware|xups|xupsBattery|xupsBatCapacity - OID: .1.3.6.1.4.1.534.1.2.4
XUPS-MIB|iso|org|dod|internet|private|enterprises|powerware|xups|xupsBattery|xupsBatteryAbmStatus - OID: .1.3.6.1.4.1.534.1.2.5
XUPS-MIB|iso|org|dod|internet|private|enterprises|powerware|xups|xupsInput|xupsInputTable|xupsInputEntry:1|xupsInputVoltage - OID: .1.3.6.1.4.1.534.1.3.4.1.2
XUPS-MIB|iso|org|dod|internet|private|enterprises|powerware|xups|xupsEnvironment|xupsEnvAmbientTemp - OID: .1.3.6.1.4.1.534.1.6.1
XUPS-MIB|iso|org|dod|internet|private|enterprises|powerware|xups|xupsBattery|xupsBatTimeRemaining - OID: .1.3.6.1.4.1.534.1.2.1
For the time remaining the collected data was in seconds so I created the following super metric to convert it to minutes for easier viewing.
floor({
This Resource: XUPS-MIB|iso|org|dod|internet|private|enterprises|powerware|xups|xupsBattery|xupsBatTimeRemaining - OID: .1.3.6.1.4.1.534.1.2.1
}/60)

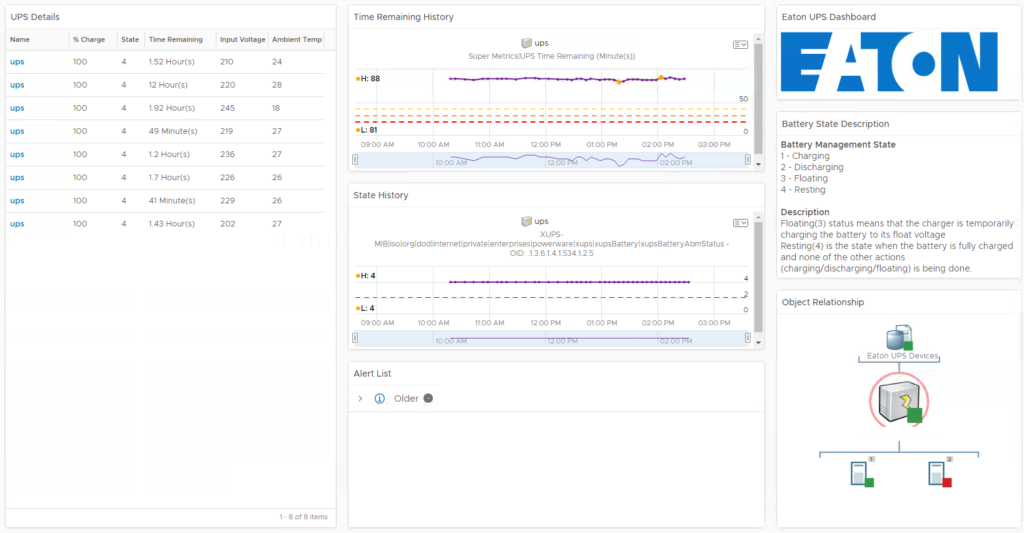
The dashboard
The dashboard I have created consist of a few different components
– Object list: This list contains all the UPS units
– History: This shows the trend of time remaining and state of the units.
– Description: It contains a description on the different states.
– Relationship: I have created a relationship from the UPS to the host it provides power to so it is easy to see what is impacted in case of a failure.
– Alerts: I tried using syslog from UPS to Log Insight and then into vROps but unfortunately most EATON units I had did not support remote syslog.
This is how the dashboard turned out.